Account admins can view analytics and export reports for various organizational activities.
📒Note: App profile admins cannot access analytics.
Click the Analytics ![]() icon at the top right of the platform to open the “Activity” page.
icon at the top right of the platform to open the “Activity” page.

View and export reports for:
Select a tab on the left and filter analytics by day, week, or month, or set a custom time frame.
In the “Content, Administrator, and User Activity” tabs, you can download reports.
Click Generate Report at the top right.
The report is sent to your email address.
📒Note: On the dashboard, you cannot generate a report and filter data by app profile.
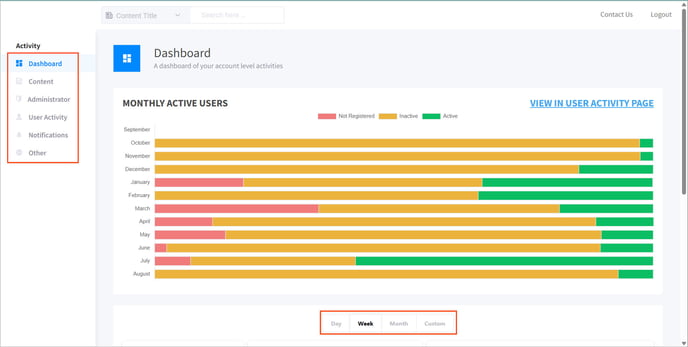
Dashboard
The dashboard provides an overview of organization-level activities.
Select Dashboard on the left to view high-level metrics.
- Employee status: Month-wise active, inactive, and unregistered employees
- Content engagement: Number of contents views in the newsfeed, new contents added, most liked and commented posts
- Employee counts: Total employees, registered and unregistered employees, license limit, and new registrations
Content
The content tab displays analytics for published content, including creation, updates, and engagement metrics.
Select Content on the left to view reports of employees’ activity on content.
- Content title
- Total content views
- Number of content views in the web app
- Number of content views in the mobile app
- Number of likes for the content
- Number of comments for the content
- Average time spent on content in the mobile app
- Average time spent on content in the web app
Administrator
The administrator tab tracks admini activity across the platform.
Select Administrator on the left to view details.
- Names
- Time spent in the app
- The number of contents and folders added
- Last login details
User activity
The user activity tab monitors engagement metrics for individual team members.
Select User Activity on the left.
Filter employee activity reports by:
- All app profiles or a specific app profile
- Group
Filter analytics by day, week, month, or set a custom the time frame, including:
- New registrations
- Average duration spent on the mobile app
- Average duration spent on the web app
- Total number of employees (active, inactive, and licensed)
📒Note: The number of licensed employees indicates the maximum number of employees you can add to the organization when creating an account.
View each employee's average time spent in the mobile and web apps, along with their profile information and login activity.
Notifications
The notifications tab tracks the performance of all notifications sent via content push, broadcast alerts, and SMS.
Select Notifications on the left to view analytics for SMS, mobile, and web notifications, including:
- Notification title
- Total sent
- Delivered
- Failed
- Errored
Other
This section provides insights into additional activities of employees across the organization.
Select Other on the left to view details.
Filter employee activity reports based on:
- All app profiles or a specific app profile
- Group
- Mobile or web app
View the most searched key terms and the number of top banner images (carousels) based on the selected filter.