Analytics gives you powerful, centralized insights into how employees adopt the app, engage with content, and respond to communications. Reviewing these insights helps you increase participation, create relevant content, and improve the meaningful impact of internal communications across the organization.
Only admins can access analytics to understand app usage and optimize their strategies.
📒Note: Account admins can access analytics for the entire organization, whereas app profile admins can access analytics for the specific app profile to which they have admin access.
Use metrics in analytics to:
- Monitor user adoption and active usage
- Understand how employees interact with the app on web and mobile
- Measure content performance using data on impressions, views, reactions, and engagement rate
- Track the effectiveness of broadcasts, SMS, and push notifications
- Identify trending searches across the platform
- Export reports
Access analytics
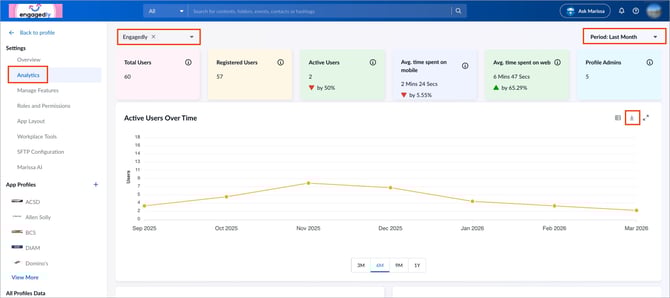
Use analytics to review real-time and historical data for a selected app profile. You can adjust the period to analyze trends over time.
Navigate to Settings > Analytics.
- At the top left of the “Analytics” page, open the app profile drop-down and select an app profile.
- At the top right, open the Period drop-down and select a time range.
- Click the Download
 icon at the top right of each visual to export it.
Dashboard summary
The analytics dashboard provides a snapshot of high-level metrics.
Key metrics
- Total users: Total users available in the app (unregistered and registered)
- Registered users: Users who have registered in the app
- Active users: Users who are actively using the app during the selected period
- Average time spent on mobile: Average time users spend on the mobile app
- Average time spent on web: Average time users spend on the web app
- System admins: Number of account admins
Trend indicators show percentage change compared to the previous period.
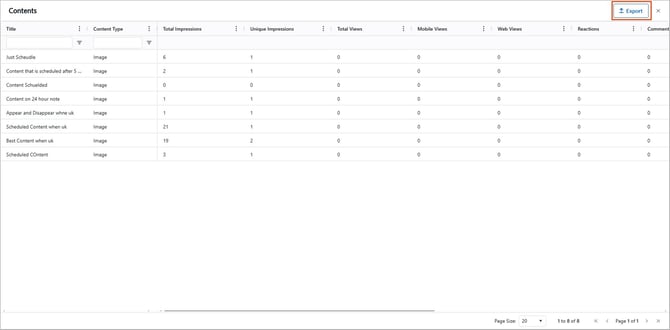
Export reports
Export reports to analyze data offline, share insights, or maintain records for the selected time range.
- Click a graph, chart, or other visual to open the detailed view.
- Click Export at the top right.
Active users over time
Shows the trend of active users over time.
Use it to:
- View monthly trends in active usage
- Switch between different time filters
Adoption rate
Overview
Displays the percentage of active users compared to registered users. This metric helps you understand how effectively the app is being adopted and actively used within your organization.
Adoption rate over time
Indicates how user adoption changes over time, helping you track onboarding effectiveness and long-term adoption trends.
Mobile users
Provides insight into how many employees, out of all registered users, are using the mobile app. This helps you understand the level of mobile app adoption within your organization.
Sessions over time
Shows the total time employees spend on the platform over a selected period, segmented by web and mobile usage.
Content analytics
Content analytics helps you understand what content is published, how employees engage with it, and which formats drive the most impact. It provides visibility into the performance of different media types and tracks engagement trends over time, enabling you to refine your content strategy with confidence.
Content summary metrics
- Total contents: Total number of published contents in the given timeframe
- Total impressions: Number of times content appears in the newsfeed, including multiple views by the same employee.
- Views: Total number of content views (includes share views)
- Reactions: Total number of reactions on the content
- Comments: Total number of comments on the content
- Shares: Number of times content is shared
- Saves: Number of times content is saved
- Average engagement per content: Average engagement calculated across all viewed content items
Content distribution by media
Shows how your content is distributed across different media types, such as images, image galleries, rich text, web links, and documents. This provides a quick snapshot of the content formats you share most often.
Engagement by media
Compares engagement levels across different media types, showing how employees respond to each format.
Use it to:
- Identify which content formats drive higher engagement
- Understand employee preferences across formats
- Optimize future content by prioritizing high-performing media types
Metrics trend
Shows how selected engagement metrics, such as impressions, reactions, comments, views, shares, and saves, change over time.
You can:
- Switch between metrics using the dropdown
- View trends across different time ranges
Use it to:
- Track engagement performance over time
- Spot increases or drops in content visibility and interaction
- Measure the impact of content or communication changes
Top 5 contents
Highlights the top five performing content pieces based on engagement, helping you understand what resonates most with employees.
Use it to identify:
- Highest-performing content
- Content formats and topics that drive strong engagement
- Engagement patterns you can replicate in future communications
Broadcast alerts
Helps you understand how reliably messages are delivered across different channels. It provides visibility into broadcast alerts, SMS, and push notifications, ensuring critical updates reach employees without gaps or delays.
This section shows the number of messages that are:
- Sent
- Delivered
- Error
- Failed
Use this to:
- Assess the reliability of each communication channel
- Compare channel performance to understand which channels employees respond to best
Trending search keywords
Shows the most frequently searched terms in the app, providing insight into what employees are actively looking for.
Use this to:
- Understand common employee questions and needs
- Identify missing, outdated, or hard-to-find content
Banner performance
Shows banner names and corresponding click counts, helping you understand which banners capture attention and drive action.
Use this to:
- Measure banner effectiveness at a glance
- Identify banners that need improved placement or messaging